A Reference Tool for Metal Surface Finish Characteristics
A metal surface finish chart is a reference material we at Metal Cutting sometimes use internally as part of our quality assurance process. (You can read more about our quality measures on the Quality Commitment page of our website.)
Typically these charts provide guidelines regarding the measurement of standard surface finishes, such as:
- The different parameters used
- The typical roughness according to different processing methods
- The conversion from a unit such as microinches (µin) to microns (or micrometers, µm)
What Are Standard Surface Finishes?
A surface finish is generally described as a measure of the texture of a surface. It is characterized by the lay (or direction) of the surface pattern, its roughness, and its waviness. Standard surface finishes include the characteristics that are frequently used in reference to the machining finishes that are achieved using different production methods.
What exactly will you find if you search the web for a “surface finish chart” and how does it relate to standard surface finishes on metal parts? Let’s take a closer look.
Ra and Other Surface Finish Units
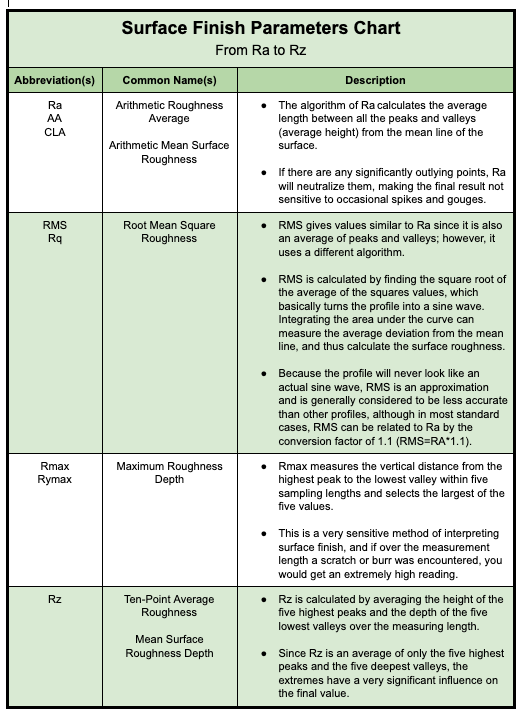
One type of metal surface finish chart might describe surface finish parameters — that is, the different units of measurement and the arithmetic calculations used to describe surface finish. A surface finish chart such as this could include the following parameters:
- The most commonly used parameter is Roughness Average (Ra). This is a calculation of the average length between all the peaks and valleys (or the average height) from the mean line of the surface. Because it neutralizes any significantly outlying points, Ra is not sensitive to occasional spikes and gouges.
- The Root Mean Square Roughness (RMS) is similar to Ra but generally considered to be an approximation and, therefore, less accurate than Ra. RMS is calculated using an algorithm that finds the square root of the average of the squares of the values. Basically, RMS turns the surface profile into a sine wave and measures the average deviation of the curve from the mean line.
- Maximum Roughness Depth (Rmax) measures the vertical distance from the highest peak to the lowest valley within the sampling lengths and selects the largest of the values measured. As a highly sensitive method of estimating surface finish, Rmax is vulnerable to burrs or scratches that lead to a higher reading, indicating a rougher surface with regard to the overall surface.
- The Mean Roughness (Rz) is calculated by averaging the height of the five highest peaks and the depths of the five lowest valleys. Because it looks at the extremes only, Rz produces values that tend to be high and may not be an accurate reflection of the average surface finish.
At Metal Cutting, we typically test for Ra, and it is what most of our customers ask for. Although Ra and RMS are sometimes used interchangeably because an approximate conversion factor is RMS = Ra x 1.11, we encourage customers to use Ra. It is considered more accurate and is widely accepted in the industry.
Surface Roughness Charts
Another type of metal surface finish chart might show the average range of surface roughness values that can be achieved using different types of manufacturing processes. This is helpful to know because surface finishes can vary greatly depending on the machining process used to produce them.
Deciding between different cutting methods is an important step if having a particular surface on your finished metal parts is critical to the success of your application. In addition, achieving a particular surface finish may require that more than one process be used.
Each metal cutting process has its own characteristics (what machinists call “witness marks”). They can be varied to a certain degree and with certain limitations, again depending on the process.
For instance, where there is a floor on how smooth a machined surface can be, you can use polishing to achieve a highly smooth surface. Or you might use grinding to create a sharp edge or shiny finish.
You can look for surface roughness charts that compare the standard surface finishes for various metal cutting methods, such as abrasive cutting, EDM, or surface grinding, as well as milling, turning, lapping, or polishing. Note that with surface finish measurement, the lower the number is, the smoother — or less rough — the surface is.
Conversions of Surface Roughness Units
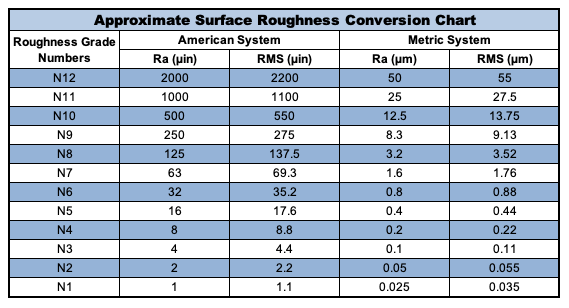
Another type of metal surface finish chart might show the conversions between different units for specific surface roughness grades. For example, the chart shown here provides the conversions between Ra and RMS, in both standard and metric measurement systems (that is, in microinches and microns/micrometers):

Note that the surface roughness conversions are approximate. That is because Ra and RMS measure different things and are only convertible with a sine wave profile — or when the peaks and valleys are perfectly the same throughout the surface, which is rarely the case in real-world settings.
Tools for Visually Comparing Surface Finishes
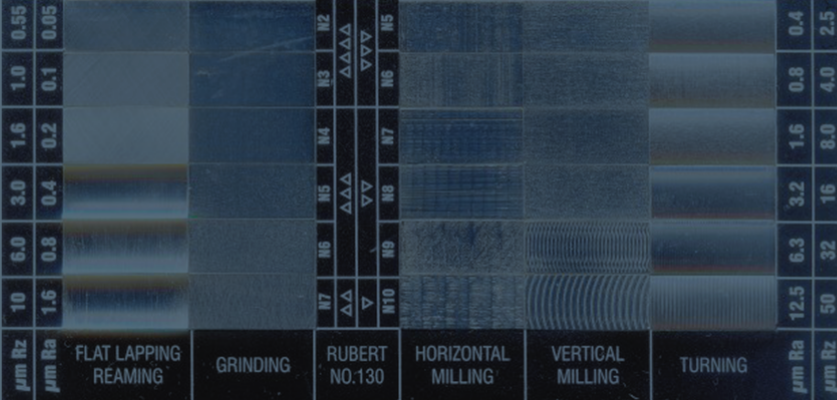
Someone who is searching the web for a chart showing standard surface finishes might actually be looking for a picture that shows what a particular surface — say, one with a roughness of 63 µin Ra — should look like.
This is where another handy reference tool comes into play: surface finish comparators, also called surface roughness comparator plates.
Surface finish comparators are inspection tools that offer an alternative to mechanically testing each part and getting an actual measurement of its Ra. Mechanical testing generally involves using one of two methods:
- A contact surface roughness profilometer, which rides a probe along the surface of the part to read it — and which can scratch or otherwise alter the part’s surface
- A non-contact, non-destructive tool that utilizes interferometry or other optical 3D metrology to measure without touching the part’s surface
However, in place of these mechanical tools, you can look at a comparator plate that shows what an Ra of 63 µin (or 32 µin, 16 µin, 8 µin, and so on) looks like compared with the part you are inspecting.
Using surface finish comparators is a quick, easy way to discern whether a part is in spec by looking at it rather than physically measuring the surface profile.
Different types of comparators
Just as there are different average surface finish ranges for different metal cutting processes, there are also different comparator plates for different processes.
That’s because, for example, an EDM-cut part will have the appearance of tiny “pits” on the surface of the end cut, while an abrasive method will produce what looks like very fine, slightly arcing lines across the end cut surface. Even the exact same Ra value may look very different depending on the cutting process used.
Therefore, it is important to be sure you are looking at the comparator plate for the correct process.
Limitations of comparators
In addition, when you get down to much lower (smoother) surface finish requirements, such as 2 µin or 1 µin Ra, comparator plates are not helpful. That’s because unless they are under high magnification, the differences between 2 µin and 1 µin Ra (or lower) will not be readily apparent.
If your particular application has a critical range — for example, each part must be between 10 µin Ra and 25 µin Ra — then comparator plates also may not be the best option. In these cases, it may be necessary to mechanically test the parts to ensure that their surface finish is within the specified range.
Exacting Surface Finish Standards
Here at Metal Cutting, the surface finishes we most often deal with are the end cut of small, precision metal parts and the body surface along the diameter of tubes and rods.
It is important to remember that if there is a blemish, ding, or scratch somewhere on a part, it may not be included in the total surface finish measurement of the part. However, we take great care to minimize these types of surface finish defects and, to the extent that the surface finish is critical to the product, we can inspect for any defects as needed.
Typical results for end cuts
Our abrasive cutting method conservatively produces an end cut of 32 or 63 µin Ra or better depending on the wheel used. (Remember, the lower the number, the smoother the surface — so “or better” means “or lower.”) We say conservatively and start with a high Ra value because different metal types play a crucial role in what can be achieved.
With a lapped part, the surface of the end cut we achieve is typically 16 µin Ra or better. And our best results are when we mechanically polish parts to end cuts as smooth as 1 µin Ra or even smoother.
Typical results for body surfaces
If a customer’s requirement is different than the raw material’s “as drawn” surface, Metal Cutting can grind the material to achieve desired results for a part’s diameter surfaces (or the body of the part). We typically achieve 8 to 16 µin Ra through grinding, but 2 to 4 µin Ra is possible under certain circumstances.
When we tumble to deburr, an added benefit is it can create a polishing action that produces an even smoother surface of 8 µin Ra or better. From there, we can use mechanical polishing techniques to bring the body surface finish down to lower than 1 µin Ra.
If a rougher surface is required, we can use sandblasting or grinding to intentionally develop a very rough surface, possibly exceeding 100 µin Ra.
(Read more about how we meet the Ra surface finish requirements of small metal parts.)
How to Satisfy Your Metal Surface Finish Needs
As you can see from the different types of metal surface finish charts, there are various surface finish options and different ways to look at surface roughness.
Fortunately, with a choice of metal cutting processes and the various finishing techniques that can be used, the right partner can produce metal parts that will meet your surface finish requirements as well as your other critical dimension needs.
To learn more, check out our video How to Avoid Last-Minute Surface Finish Issues.


